Learn statistics that finally makes sense — no ads, no account, no Wi-Fi needed
StatRise is a statistics and probability study app for students: 54 step-by-step lessons, 39 calculators, 600+ practice questions, and interactive simulations — all running on your device.
Free download with free calculators included · StatRise Pro unlocks the full calculator library and worked solutions · iPhone & iPad, iOS 16+ · Android

- 54step-by-step lessons
- 39stats & probability calculators
- 600+practice questions
- 6interactive simulations
Inside the app
Four screens, four ways StatRise gets used
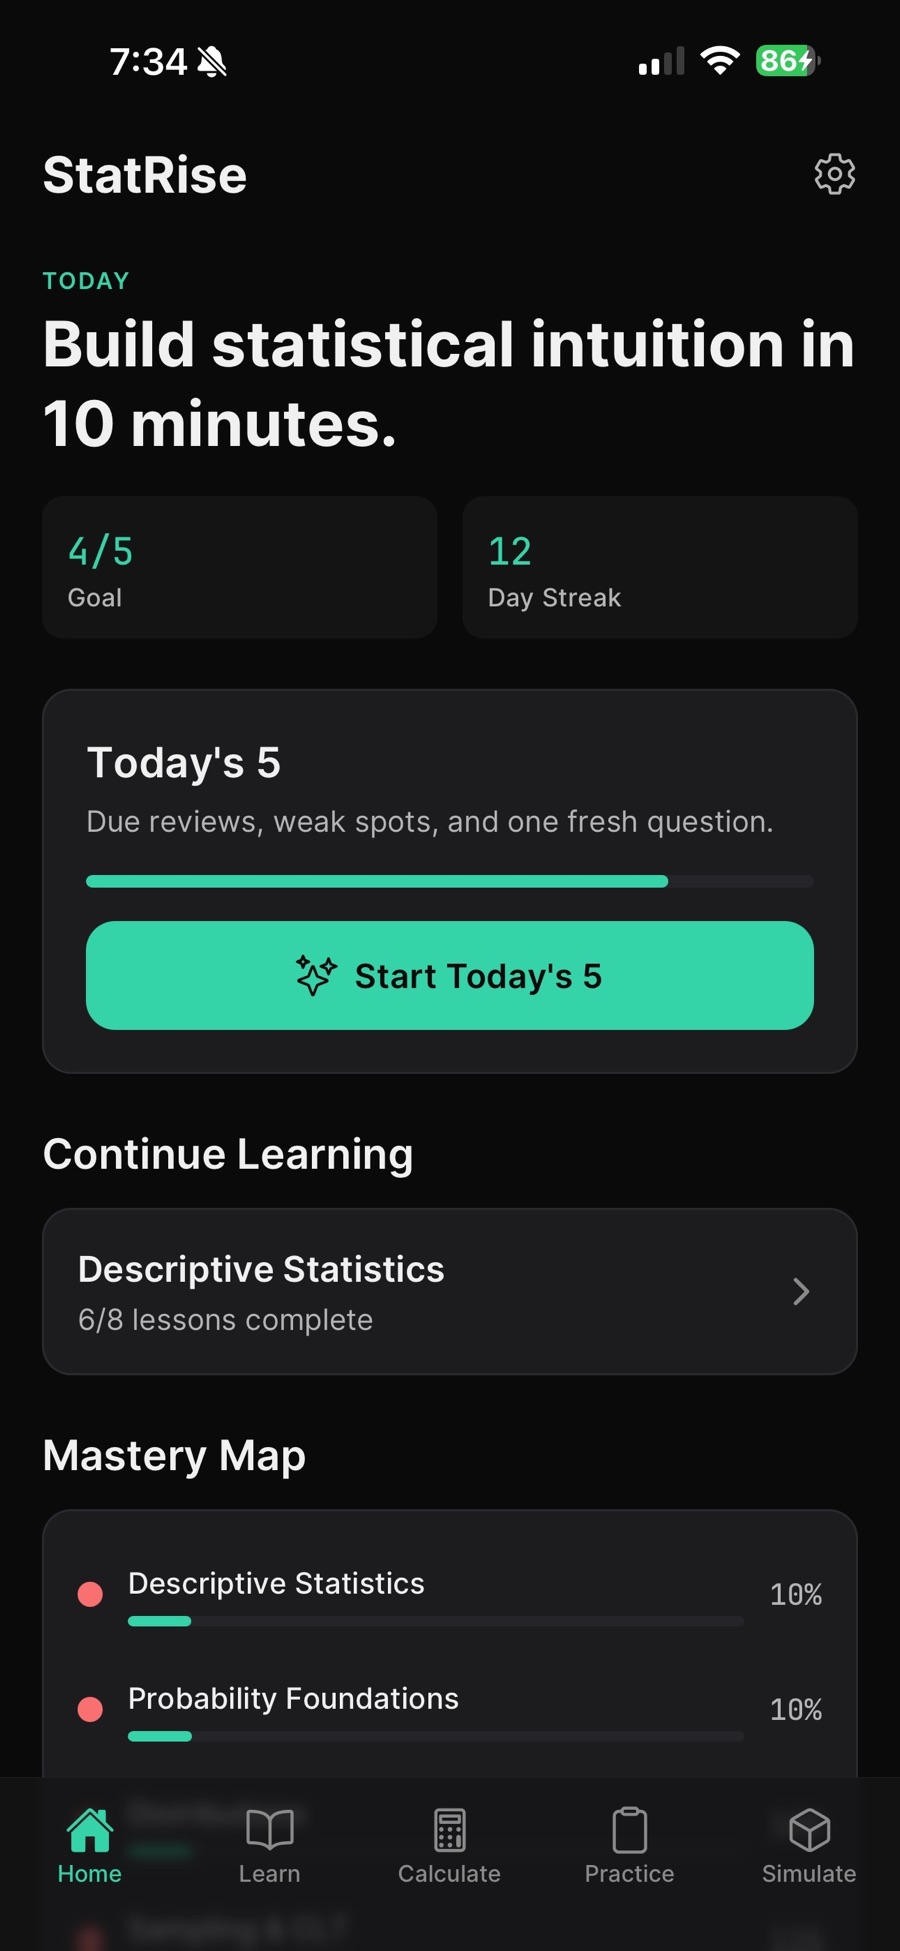
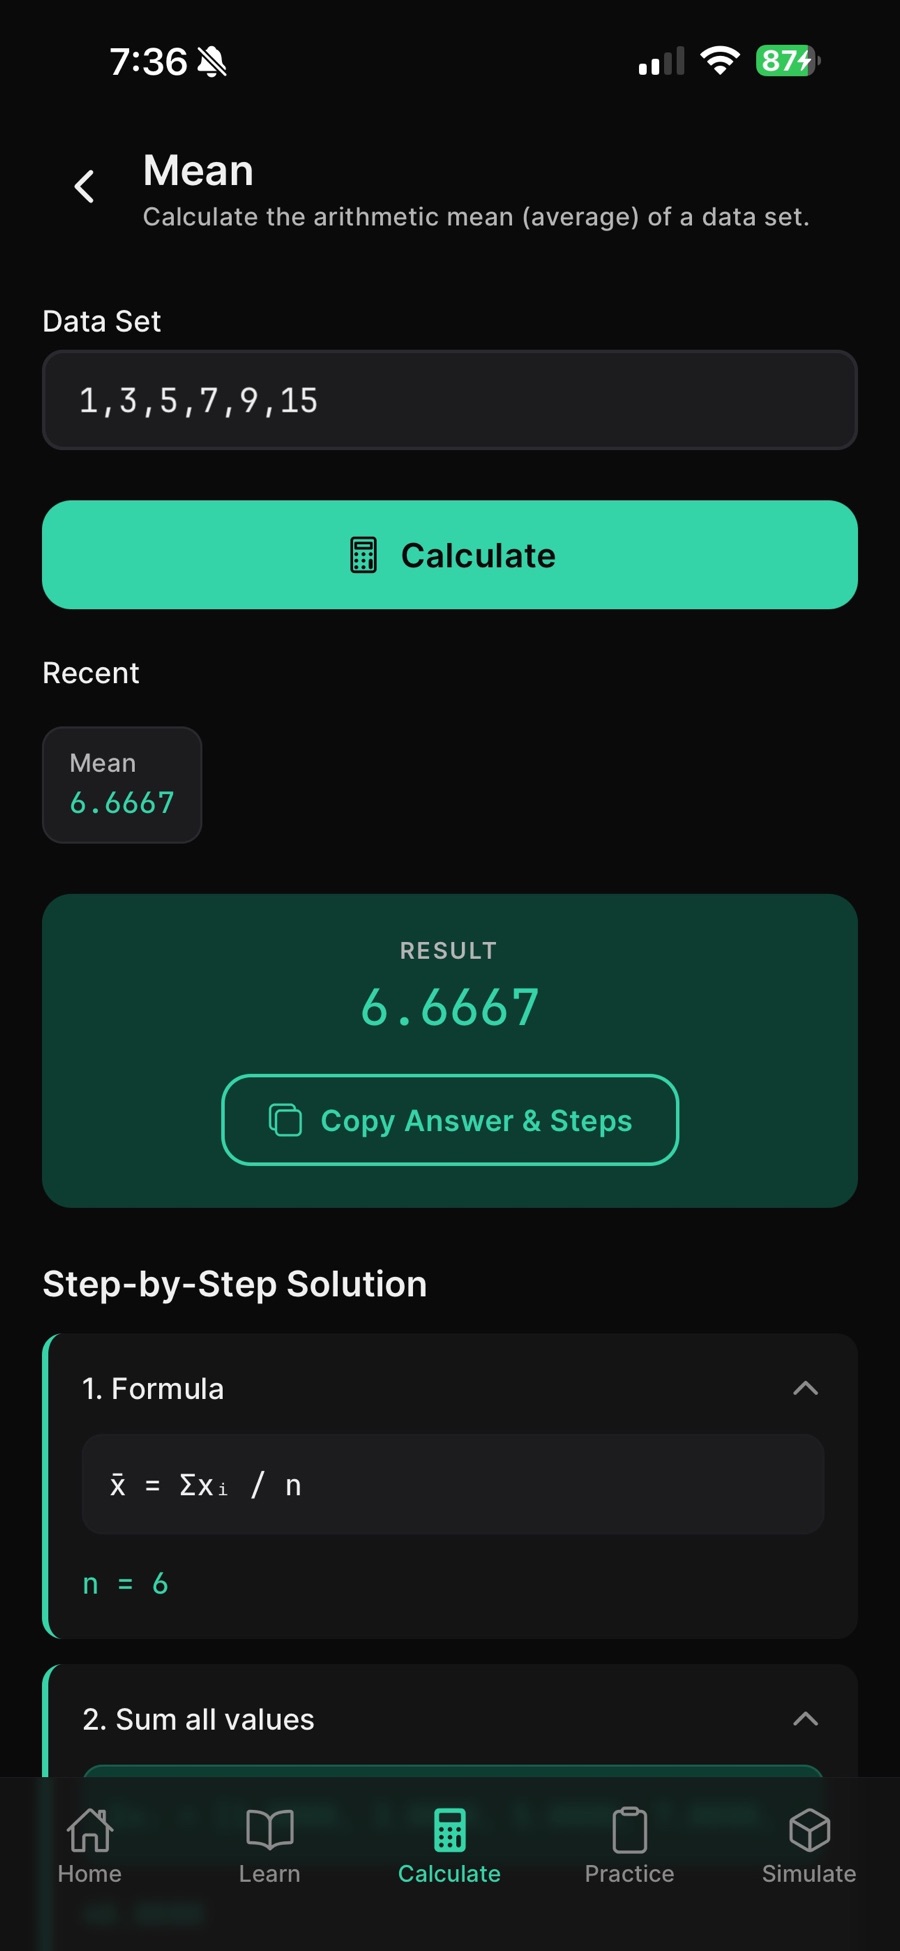
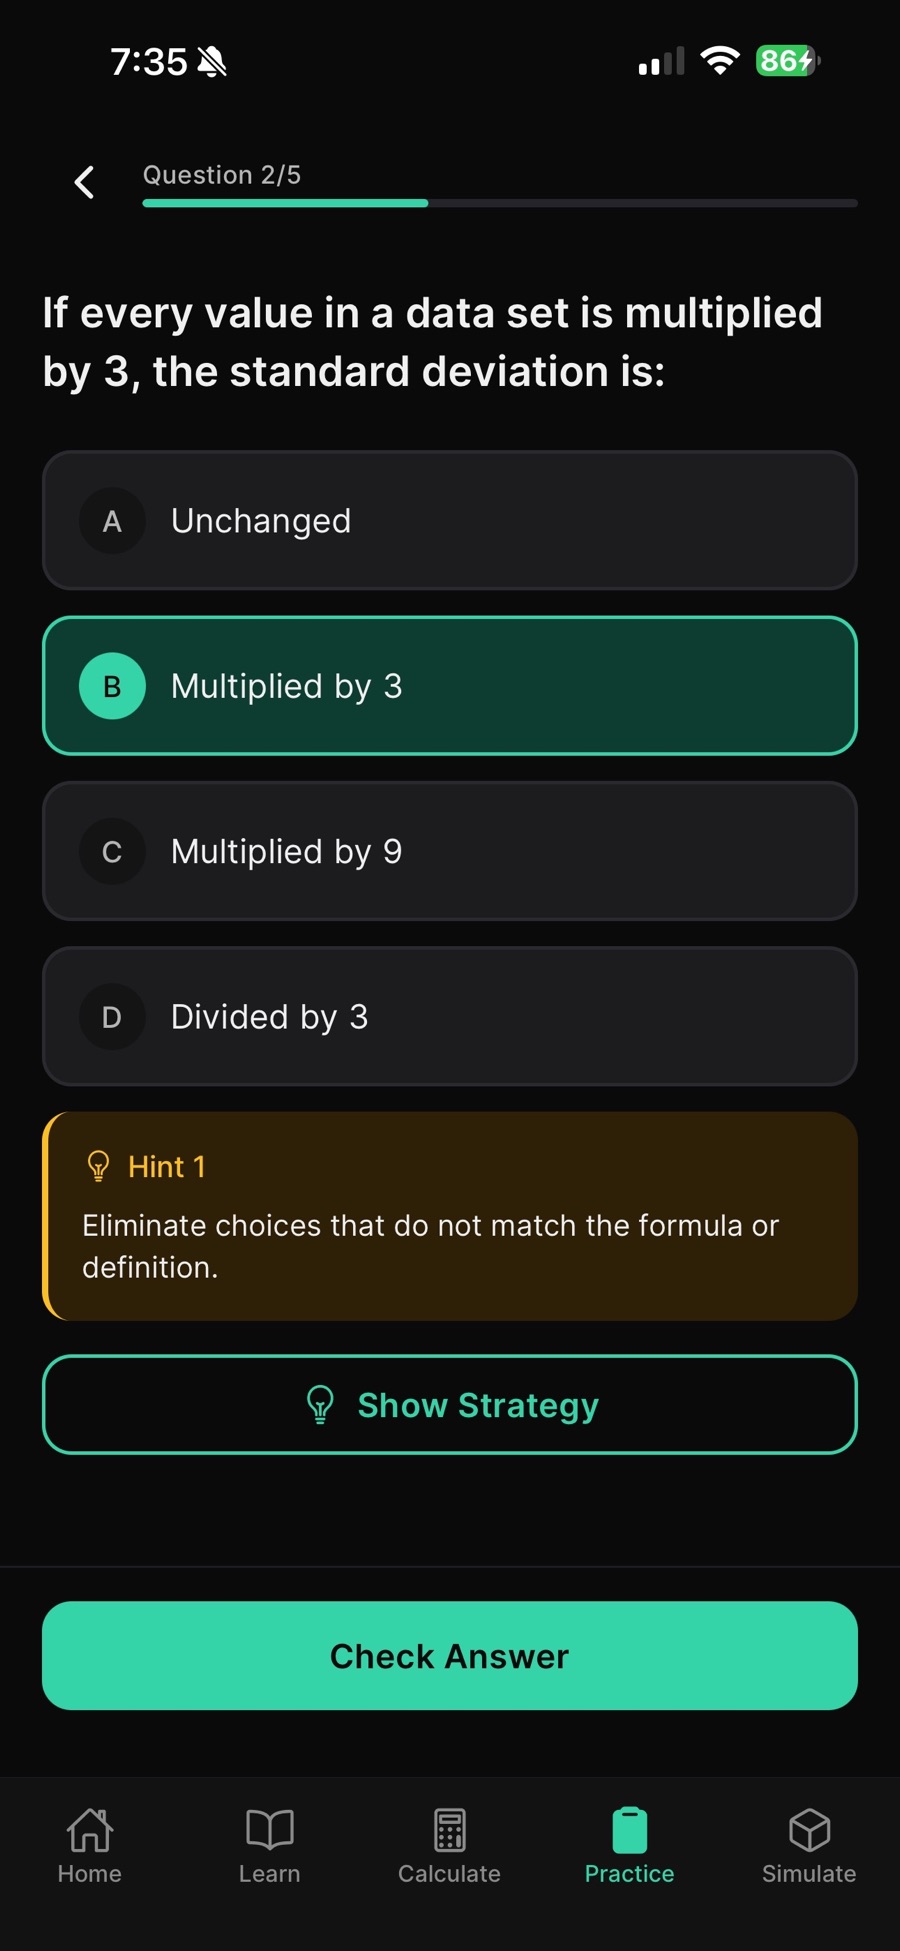
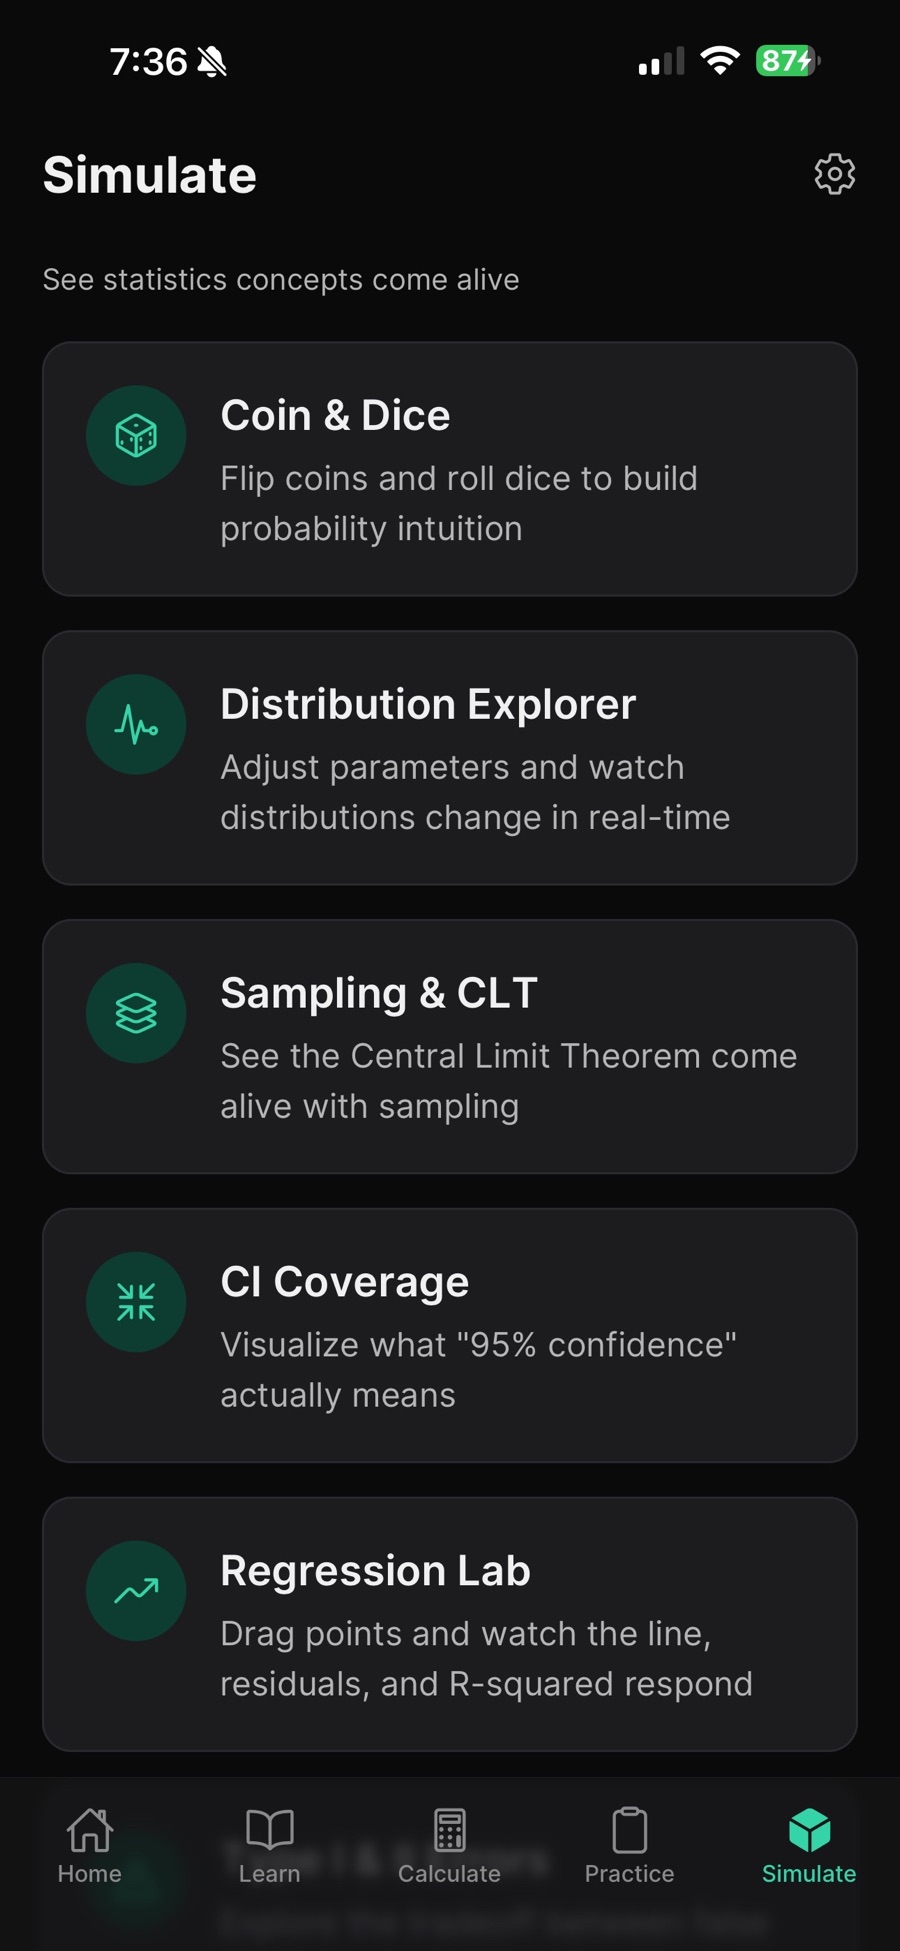
Real screenshots from the iPhone app — the daily review set, a calculator with its worked solution, a practice question, and the simulation library.
Why StatRise exists
Statistics is hard enough without fighting your study tools
The usual way
- Online calculators that spit out an answer with zero explanation of the work behind it
- Study sites buried in ads, paywalls, and sign-up walls
- Tools that stop working the moment you lose Wi-Fi — in class, on the bus, during a flight
- Abstract ideas like the Central Limit Theorem taught with formulas alone
The StatRise way
- Calculators paired with worked solutions, so you understand the work behind the answer
- No ads, no login system, no tracking, no custom backend
- Offline-first: core lessons, calculators, practice, and simulations run on-device
- Interactive simulations that let you see probability and sampling in action
Lessons
54 lessons across the 6 modules every stats course is built on
Each lesson is built for students who want clear definitions, formulas, examples, and practical intuition — whether you're prepping for AP Statistics, taking intro stats in college, or reviewing on your own.
Descriptive statistics
Descriptive statistics and data visualization: summarize and picture your data before you analyze it.
Probability
Probability rules, conditional probability, and Bayes theorem — the logic layer under everything else.
Distributions
Normal, binomial, and Poisson distributions and when each one applies.
Sampling & CLT
Sampling distributions and the Central Limit Theorem — the bridge from data to inference.
Inference
Confidence intervals and hypothesis testing, explained for intuition as well as exams.
Regression
Regression, correlation, residuals, and R-squared — modeling relationships between variables.
Calculators
39 calculators that show the work, not just the answer
Use StatRise as a statistics calculator and quick homework helper. Free users get the included free calculators; StatRise Pro unlocks the full library plus step-by-step worked solutions.
Descriptive stats
- Mean, median, mode, range
- Variance & standard deviation
- Quartiles, IQR, skewness, kurtosis
Probability & counting
- Complements, unions, intersections
- Conditional probability & Bayes theorem
- Permutations, combinations, factorials
Distributions
- Normal distribution tools
- Binomial distribution tools
- Poisson distribution tools
Hypothesis tests
- Z-tests and t-tests
- Paired t-tests
- Chi-square tests & ANOVA
Confidence intervals
- Intervals for means
- Intervals for proportions
Regression
- Linear regression & correlation
- R-squared & residuals
- Scatter plots
Practice
600+ practice questions with a system that targets your weak spots
Every question comes with a detailed explanation, and your progress — accuracy, streaks, weekly goals, and topic mastery — is stored locally on your device. No account required.
Today's 5
A focused daily review set, so consistent studying takes minutes instead of willpower.
Mixed practice
Choose exactly what to study and drill the topics your course is covering right now.
Timed exam mode
Practice under the clock to build the pacing you need on test day.
Mistake review
Missed questions are tracked automatically so you can revisit them until they stick.
Spaced revision
Weak topics come back at the right time, following how memory actually works.
Local progress
Accuracy, streaks, weekly goals, and topic mastery — tracked on-device, never uploaded.
Simulations
See probability and statistics, don't just memorize them
Interactive simulations make abstract ideas easier to understand — the concepts most students find hardest become things you can watch happen.
Coin & dice simulator
Watch relative frequency settle toward true probability as trials pile up.
Distribution explorer
Change parameters and see distribution shapes respond in real time.
Sampling & CLT visualizer
See sampling distributions form and the Central Limit Theorem emerge.
CI coverage simulator
Understand what "95% confidence" really means by watching intervals hit and miss.
Regression lab
Explore how points, outliers, and fit lines interact.
Type I & II error visualizer
See the trade-off between false positives and false negatives.
Who it's for
One app, four ways to use it
AP Statistics
Use StatRise as an AP Statistics review app: lessons across all six core modules, timed exam mode for pacing, and spaced revision to keep earlier units fresh.
Intro stats in college
A companion for your first statistics course — clear definitions, formulas, and worked examples for everything from standard deviation to ANOVA.
Homework help
A quick homework helper when you need to understand the work behind the answer, not just copy a result.
Self-study
Learning statistics on your own? Work through the 54 lessons in order, and let Today's 5 and mistake review keep you on track.
Offline-first & private
Your study data stays on your device
- No ads
- No login system or accounts
- No tracking
- No custom backend
- Core lessons, calculators, practice, and simulations run on-device
- Progress stored locally: accuracy, streaks, weekly goals, topic mastery
- Only purchases and restores require an App Store connection
FAQ
Frequently asked questions
StatRise is free to download and includes free lessons, practice, simulations, and a set of free calculators. StatRise Pro is an optional upgrade that unlocks the full 39-calculator library and step-by-step worked solutions.
Yes. Core lessons, calculators, practice questions, and simulations all run on-device, so you can study without an internet connection. Only purchases and purchase restores require an App Store connection.
No. StatRise has no login system, no ads, no tracking, and no custom backend. Your progress — accuracy, streaks, weekly goals, and topic mastery — is stored locally on your device.
Yes. StatRise is designed to work as an AP Statistics review app and intro stats companion. Its 54 lessons cover descriptive statistics, probability, distributions, sampling and the Central Limit Theorem, confidence intervals and hypothesis testing, and regression — and timed exam mode helps with test pacing.
54 lessons across 6 modules: descriptive statistics and data visualization; probability rules, conditional probability, and Bayes theorem; normal, binomial, and Poisson distributions; sampling distributions and the Central Limit Theorem; confidence intervals and hypothesis testing; and regression, correlation, residuals, and R-squared.
Yes. StatRise is available for iPhone and iPad (iOS 16.0 or later) on the App Store, and for Android on Google Play.
Free guides
Study smarter with our statistics guides
Evergreen explainers written for students — no app required to get value from them.
How to Study for AP Statistics
A realistic study plan by unit, plus the mistakes that cost students the most points.
Read the guide →
Understanding the Normal Distribution
Why the bell curve shows up everywhere, and how z-scores and the empirical rule work.
Read the guide →
Which Statistical Test Should I Use?
Z-test, t-test, chi-square, or ANOVA — a plain-English decision guide.
Read the guide →
Descriptive vs. Inferential Statistics
The two halves of statistics, what separates them, and why the distinction matters.
Read the guide →
Spaced Repetition for Statistics
The memory science behind spaced review, and how to apply it to math-heavy subjects.
Read the guide →
Ready to make statistics click?
Download StatRise free and start with the lessons, practice, and simulations. Upgrade to Pro when you want the full calculator library with worked solutions.